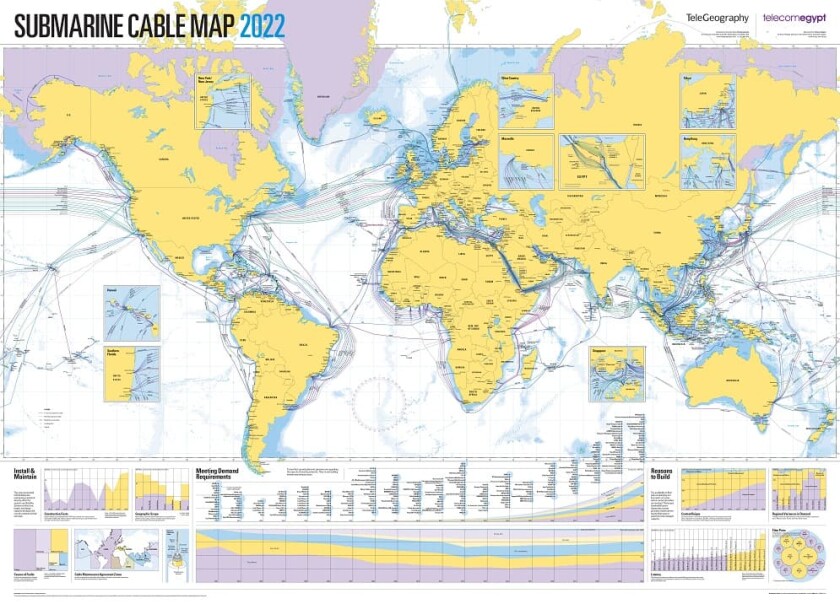
Global subsea cable investment is expected to continue, as every major subsea route saw new cables deployed between 2016 and 2021.
While 2016 to 2018 saw spend on new subsea cables exceed $2.2 billion, annual investment started to fluctuate in 2019. TeleGeography expects subsea cable spending to be bolstered by hyperscalers who will shift their position from generating demand to generating supply.
“Our research has shown constant advancement year-on-year, as pressure for bandwidth continues to grow,” said Alan Mauldin, research director at TeleGeography.
“Content providers' international bandwidth growth has accelerated as of late. Companies like Meta, Microsoft, and Netflix have millions of users who are driving up demand every day.”
The findings come as the company publishes its latest Submarine Cable Map and Africa Telecom Map for 2022, sponsored by Telecom Egypt.
These latest maps include cables that came into service between 2016 and 2021, with a combined construction cost of $12 billion.
The Africa Telecom Map includes 71 cables connected to continent that are either active or under construction. The map also features details on used bandwidth, internet capacity, pricing trends, and content provider investment, as well as broadband and mobile penetration rates for each country.
“The value of regionalizing our maps is that we can explore the trends in greater depth,” added Mauldin.
“For example, we can see in our latest regional map of Africa that Europe remains the dominant location for traffic exchange out of the continent and 80% of international bandwidth from African countries connects to facilities in Europe.”
In related news, last month TeleGeography published its latest regional overview of the Latin American connectivity market.
The report predicts that used international bandwidth in Latin America will grow from 150Tbps in 2021 to almost 700Tbps by 2026 at a compound annual growth rate (CAGR) of 36%.


